DocumentationFeatures
Reports
The Reports section: project statistics, agent performance, task and daily reports, and token usage per agent and per day.
The Reports section shows how the project is going: what is finished, how runs went, the reports agents wrote, and how many tokens the work used. Everything here belongs to the active project, except the token view, which can also show all projects.
Open it with Reports in the project’s section bar or Ctrl+6.
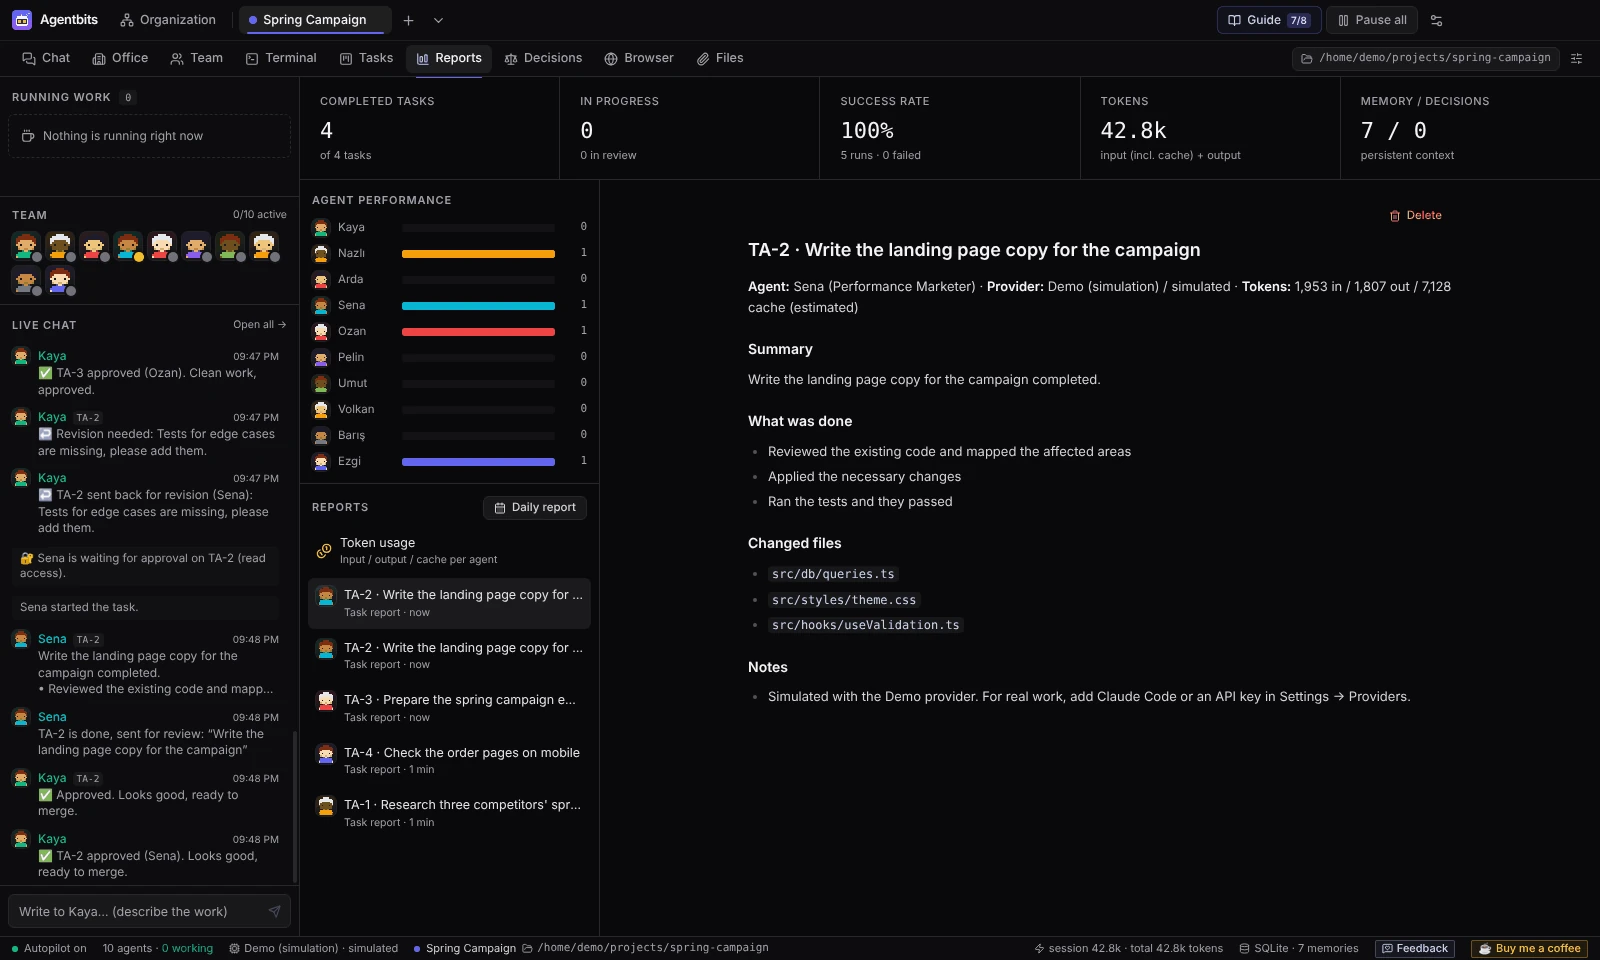
Statistics
The cards at the top summarize the project:
| Card | What it shows |
|---|---|
| Completed tasks | Tasks in Done, out of all tasks in the project |
| In progress | Tasks being worked on, and how many are in review |
| Success rate | Share of successful runs, with the number of runs and failures |
| Tokens | Input (including cache) plus output; cost when the provider reports it |
| Memory / Decisions | The persistent context the project has built up |
Below the cards, Agent performance shows how each project member has done in this project. It stays empty (“No runs in this project yet.”) until agents have run tasks.
Task reports
When an agent finishes a task successfully, its report is saved here as a Task report. Agents are asked to write the report with a summary, what was done, the changed files and notes. If the agent produced files, the report also has a files section that lists them (see Files).
The same report is posted in the task’s thread, and the task moves on to review (see Tasks).
Daily report
Click Daily report to create a report for the active project for today. It is written in Markdown and covers:
- the board counts,
- the tasks finished today,
- how the members performed,
- the decisions made today,
- resource usage.
Daily reports are listed with the Daily label. You create them by hand; there is no schedule.
Note: Reports are stored in the language they were written in. Changing the interface language later does not translate them.
Token usage
Token usage shows how many tokens the agents used, per agent and per day. It counts task runs, chat replies and lead reviews.
Use the switch at the top to choose the scope: This project or All projects.
Summary cards
- This session: since you opened the app this time.
- All time: everything recorded.
- Input (excluding cache), Output (generated) and Cache (reads and writes shown separately).
- Cost: as reported by the provider.
Agent table
Each agent has a row with Current task, Session and Total, and a Source column that tells you how far to trust the numbers:
| Source | Meaning | Provider |
|---|---|---|
| actual | Input, output and cache are reported separately | Claude Code CLI, Anthropic API, OpenAI API |
| total only | Only the total is reported | Codex CLI |
| estimated | Simulated numbers | Demo |
| not reported | No usage data | — |
Usage of agents you have deleted is kept and shown as “Deleted agent”, so the totals stay correct.
Last 14 days
A chart shows the usage of the last 14 days. Hover over a day to see its input, output and cache.
About cost
Only Claude Code reports a cost in $. For the Anthropic and OpenAI APIs, Agentbits counts tokens but does not calculate a cost. Codex CLI reports only a total token count and no cost. Cache reads are usually billed much cheaper than normal input, so check your provider’s pricing before drawing conclusions from the totals.
Warning: There is no budget or spending limit in Agentbits 0.1. Keep an eye on usage here and in your provider’s own dashboard.
Where else you see tokens
- The token strip on each agent terminal: task, session and total.
- The agent panel in the Office and the rows of the Team section.
- The status bar at the bottom: totals for this session and all time.
Token records stay after you delete a project, so all-time totals remain correct. Only a reset in Settings → Data management removes them (see Settings).
Not available yet
Custom reports are planned but not available in 0.1. See Limitations.
Found something wrong or missing? Open an issue on GitHub